Call us at: (800) 557-7142
THE FALCON PORTFOLIO TRADER
The Falcon Portfolio Trader trades a diverse portfolio of 40 stocks and ETFs with the purpose of obtaining more consistent returns than non-portfolio methods of trading. It may also be traded with options on these stocks. While it is possible to automate it, we prefer to trade it manually because the trades take about 3-5 weeks (on average).
Falcon customers who have spent at least $4,000† with us over a 4 year period of time may receive a free lifetime license to use one of the Falcon Portfolio Trader systems. Customers who have spent at least $3,000† may receive a 2 year license. Customers who have spent at least $2,500† may receive a 1 year license. For every additional $2,000 a customer can get additional licenses (either A or B). After the free initial setup and consultation there may be additional charges for frequent or extended setups/consultation.
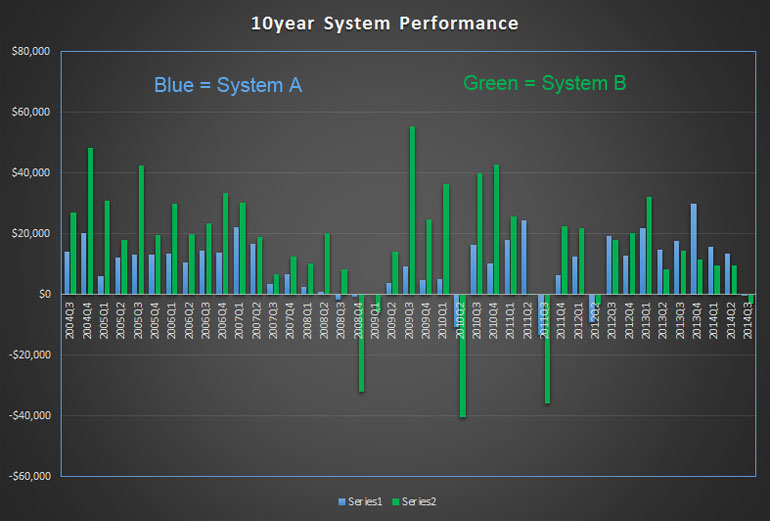
There are two systems that have similar internal structures which are available: The Falcon Portfolio Master A and B systems. The A system trades more often, makes less per trade, and has more trade in play at any given moment in time. The B system waits for bigger moves, makes more per trade, and rarely has more than 12 trades active at any time. System A has performed better than System B in the last 3 years but system B has performed better during the choppier leading up to the market crash in 2008. By selling Call and Put spreads that are 5% OTM you can make money more consistently than by trading the stocks themselves, and it can be done with a smaller trading account.
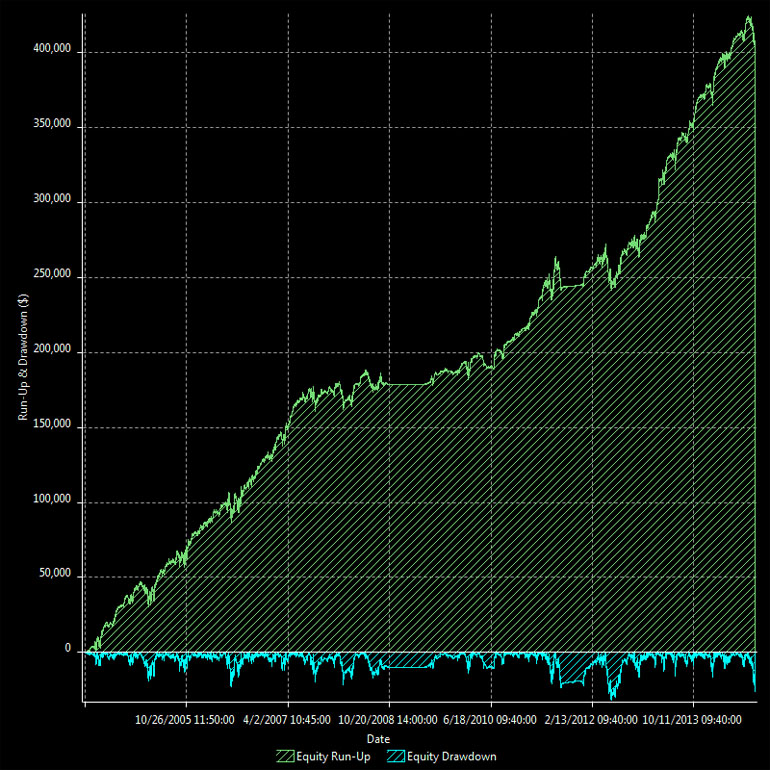
| A-System performance with 40 symbols traded | |||
|---|---|---|---|
| Backtest Period: | 10 years | Start Date: | 5/27/2004 |
| Number of Trades: | 2,351 | Last Trade Date: | 10/8/2014 |
| Percent Profitable: | 84.47% | Percent in the Market: | 92.2% |
| Trade Size: | $7,500 | Trade Size Constant: | Yes |
| Average Winning Trade: | $357.70 | Recommended account size: | $75,000+ |
| Average Losing Trade: | $850.97 | Trade Entry/Exit slippage cost: | $11,452 |
| Net Profit / Number of Trades: | $175.97 | Broker Commissions paid: | $22,839 |
| Profit Factor: | 2.35 | Net Profit: | $413,708 |
| Max Close to Close Drawdown: | $21,769 | Return as % of drawdown: | 1,300% |
| Max Mark to Market Drawdown: | $31,822 | Max Drawdown Date: | 6/4/2012 |
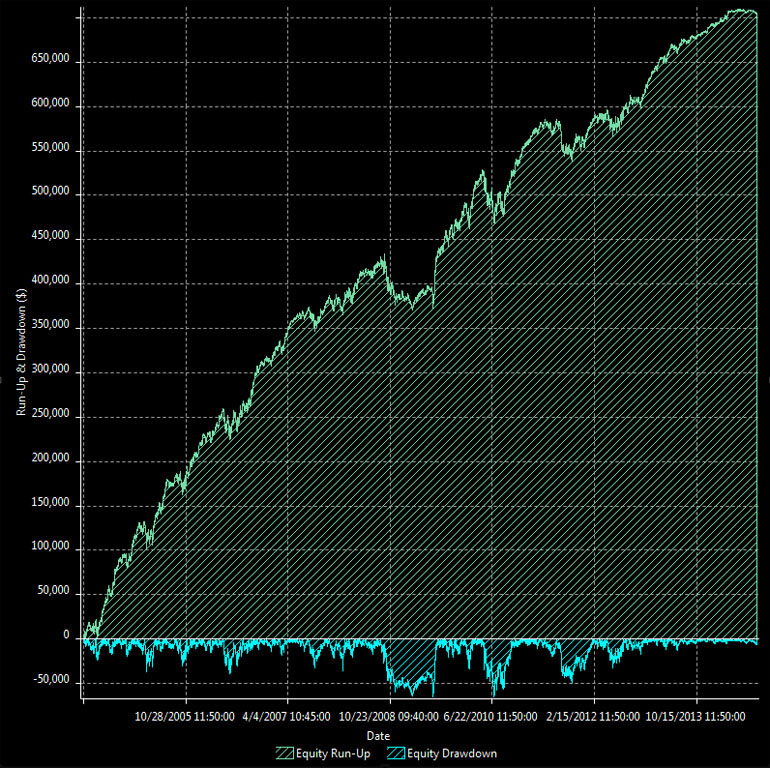
| B-System performance with 40 symbols traded | |||
|---|---|---|---|
| Backtest Period: | 10 years | Start Date: | 6/1/2004 |
| Number of Trades: | 1,653 | Last Trade Date: | 10/7/2014 |
| Percent Profitable: | 97.41% | Percent in the Market: | 99.84% |
| Trade Size: | $7,500 | Trade Size Constant: | Yes |
| Average Winning Trade: | $363.10 | Recommended account size: | $50,000+ |
| Average Losing Trade: | $842.22 | Trade Entry/Exit slippage cost: | $12,495 |
| Net Profit / Number of Trades: | $418.02 | Broker Commissions paid: | $14,935 |
| Profit Factor: | 21.91 | Net Profit: | $709,378 |
| Max Close to Close Drawdown: | $7,696 | Return as % of drawdown: | 1,089% |
| Max Mark to Market Drawdown: | $65,117 | Max Drawdown Date: | 7/1/2010 |
This strategy does include short trades, which requires a margin account. The chart above and the trading results* listed below include the following assumptions: 85% of exits use a limit order. All entries use a market order. Limit orders are only counted if the price trades through the limit price by at least one tick. Commissions are assumed to be $4.99 each way. Slippage is assumed to be 6 cents on market orders. Trades are not executed intra-bar. The system does watch the VIX such that there may be periods of time when it does not trade due to the VIX being too high. The system typically enters trades early and waits for the profit target with a wide stop loss. Due to these early entries and that it closes profitable trades, it normally shows a constant negative value for open trade net profit.


† - Purchases must have included at least one laptop or desktop computer. Special discounts received will reduce the effective value of the purchase by 8:1 (e.g. a $100 discount will reduce the purchase value by $800). If you have bought a Falcon desktop or laptop computer in the last 4 years then you can pay to make up for a shortfall at the rate of 1:3 (e.g. if you were $900 short of a lifetime license then you can pay $300 to get it ). Each license can be used for one TradeStation Customer ID or one MultiCharts User ID. After the first license, an additional license can be obtained for every additional $2,000 in purchases from Falcon (e.g. $6,000 in purchases for 2 licenses, $8,000 for 3, etc.). This is a limited time offer and may be withdrawn at any time.
* - HYPOTHETICAL PERFORMANCE RESULTS HAVE MANY INHERENT LIMITATIONS, SOME OF WHICH ARE DESCRIBED BELOW. NO REPRESENTATION IS BEING MADE THAT ANY ACCOUNT WILL OR IS LIKELY TO ACHIEVE PROFITS OR LOSSES SIMILAR TO THOSE SHOWN. IN FACT, THERE ARE FREQUENTLY SHARP DIFFERENCES BETWEEN HYPOTHETICAL PERFORMANCE PROGRAM.
ONE OF THE LIMITATIONS OF HYPOTHETICAL PERFORMANCE RESULTS IS THAT THEY ARE GENERALLY PREPARED WITH THE BENEFIT OF HINDSIGHT. IN ADDITION, HYPOTHETICAL TRADING DOES NOT INVOLVE FINANCIAL RISK, AND NO HYPOTHETICAL TRADING RECORD CAN COMPLETELY ACCOUNT FOR THE IMPACT OF FINANCIAL RISK IN ACTUAL TRADING. FOR EXAMPLE, THE ABILITY TO WITHSTAND LOSSES OR TO ADHERE TO A PARTICULAR TRADING PROGRAM IN SPITE OF TRADING LOSSES ARE MATERIAL POINTS WHICH CAN ALSO ADVERSELY AFFECT ACTUAL TRADING RESULTS. THERE ARE NUMEROUS OTHER FACTORS RELATED TO THE MARKETS IN GENERAL OR TO THE IMPLEMENTATION OF ANY SPECIFIC TRADING PROGRAM WHICH CANNOT BE FULLY ACCOUNTED FOR IN THE PREPARATION OF HYPOTHETICAL PERFORMANCE RESULTS AND ALL OF WHICH CAN ADVERSELY AFFECT ACTUAL TRADING RESULTS.